Power BI · Admissions
3 pagesAdmissions funnel
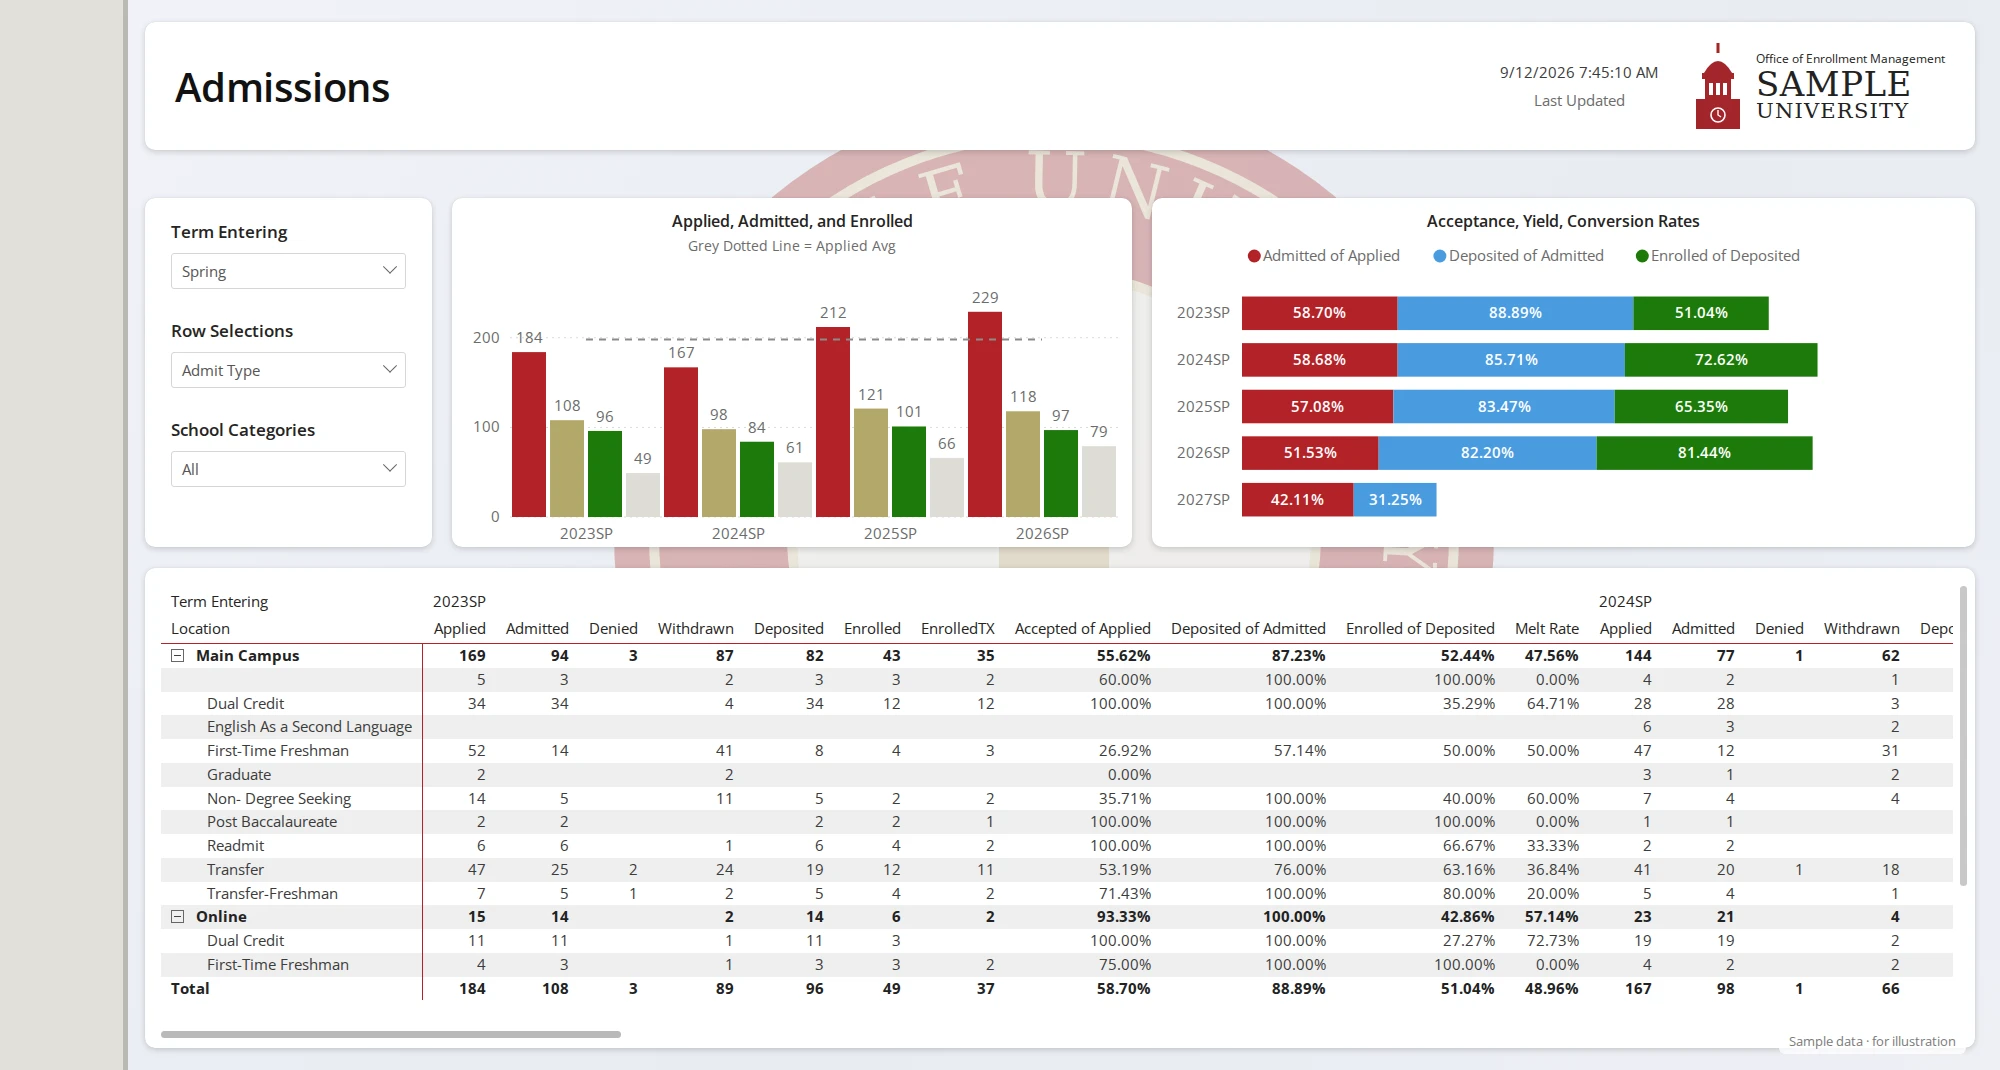
Inquiry to enrolled: application volume, conversion rates, and yield by term, program, and demographic segment.
View all pagesEnterprise Analytics · University of Central Florida
Power BI, PostgreSQL, and federal reporting for higher education. Built inside the institution, designed for the boardroom.
Power BI · PostgreSQL · Microsoft Fabric · Orlando, FL
Featured report
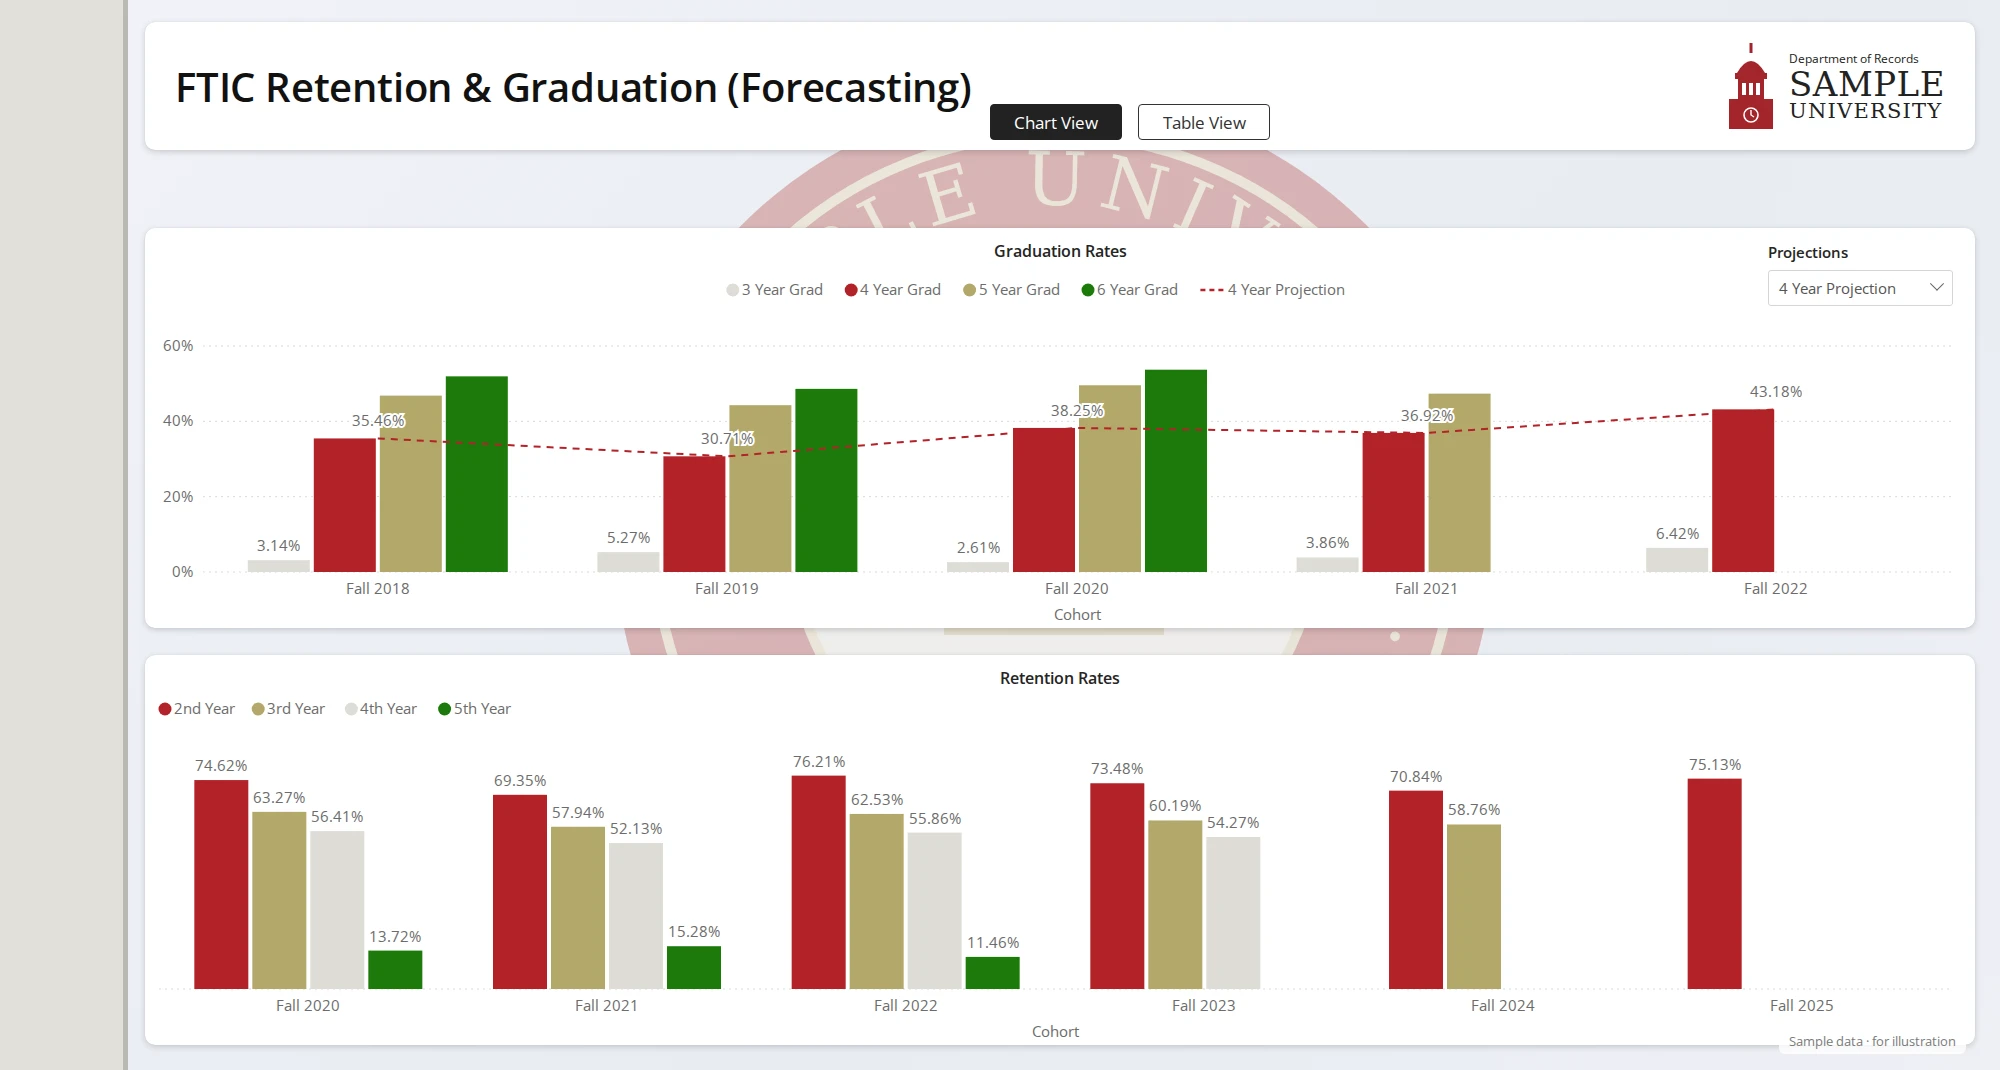
FTIC retention and graduation, tracked end to end from PostgreSQL views: 1- to 4-year retention and 4- to 6-year graduation with IPEDS demographic breakdowns.
Selected work
Power BI reports built from PostgreSQL views on the Colleague ODS, plus a SQL learning platform I built on the side. Select any report to see it full size. Screenshots use sample data.
Power BI · Admissions
3 pagesInquiry to enrolled: application volume, conversion rates, and yield by term, program, and demographic segment.
View all pages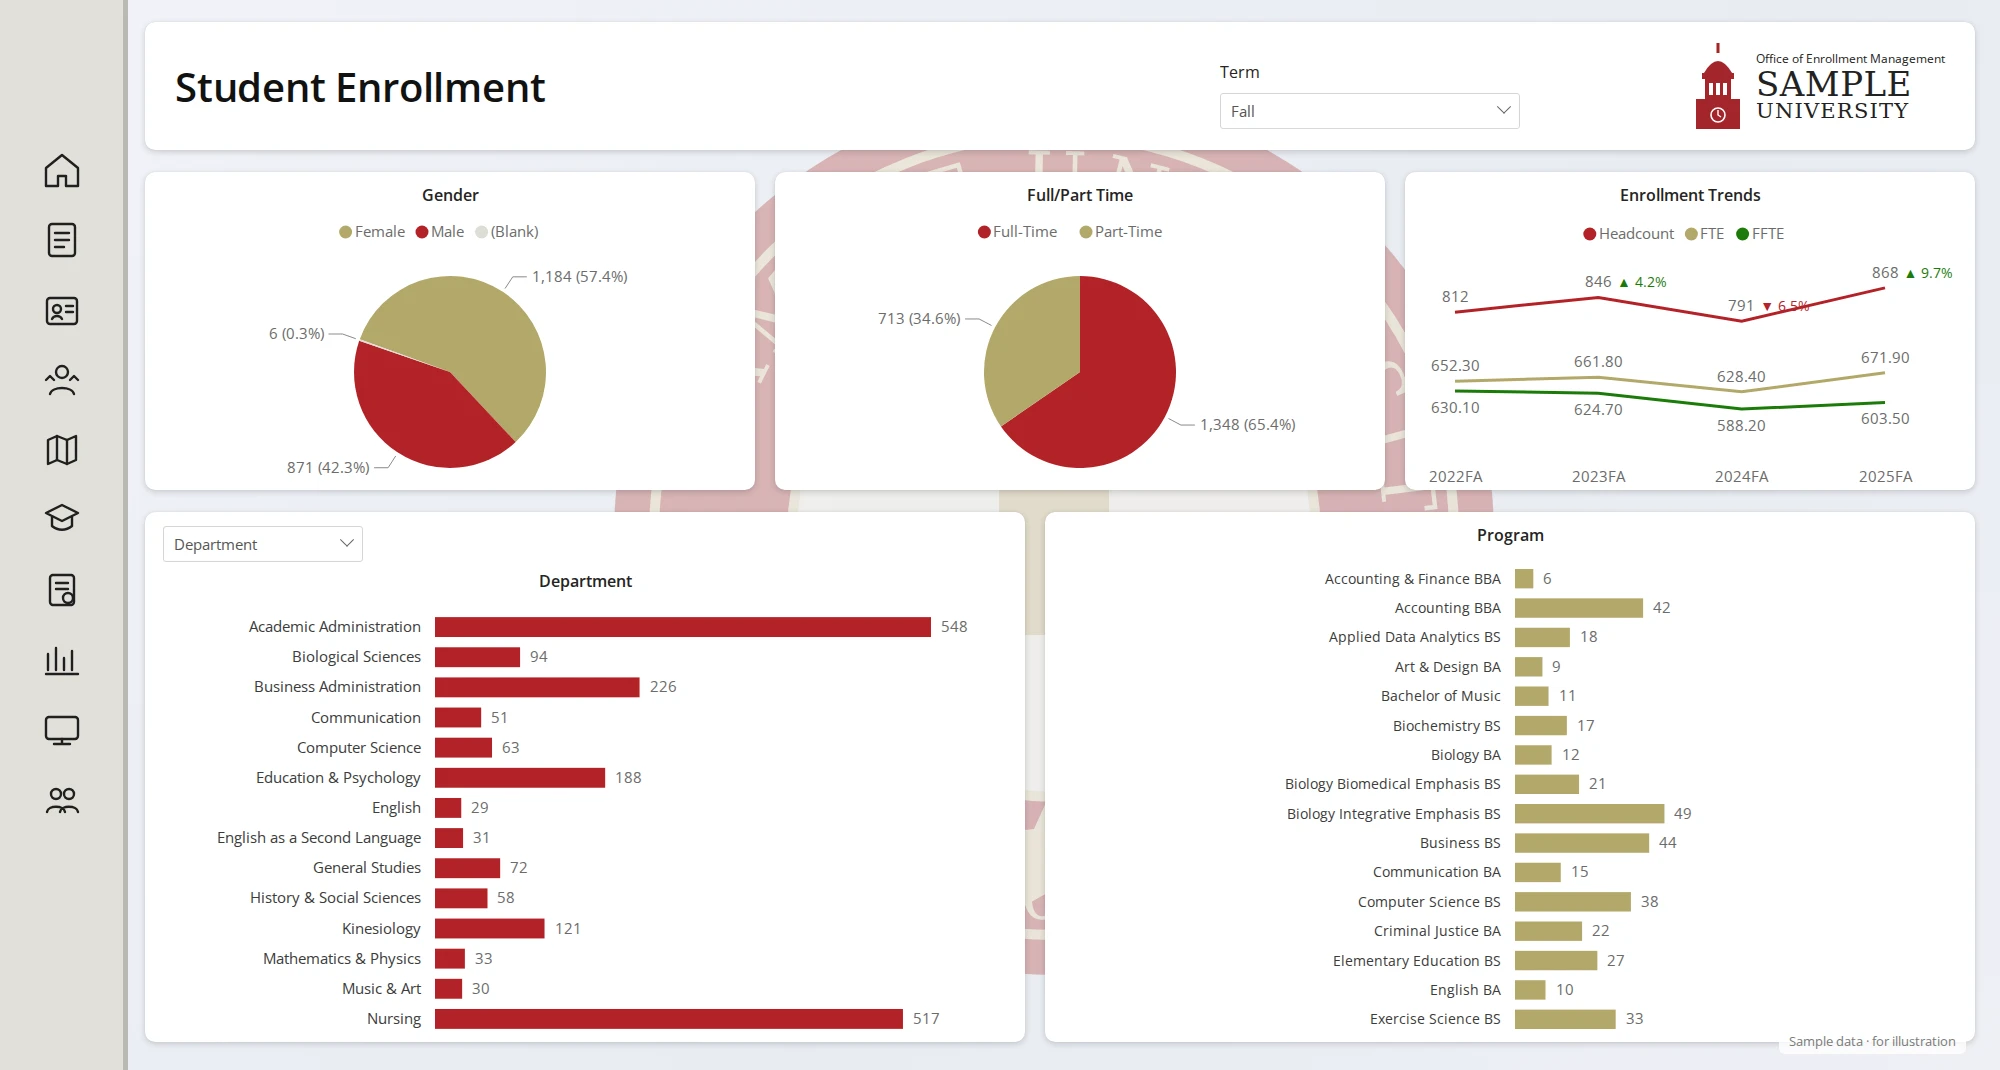
Power BI · Enrollment
Census snapshot and historical trends: headcount, credit hours, and term-over-term comparisons across academic levels.
View full sizePower BI · Retention · IPEDS
End-to-end cohort tracking from PostgreSQL views: 1- to 4-year retention and 4- to 6-year graduation with IPEDS demographic breakdowns and forecasting.
View full size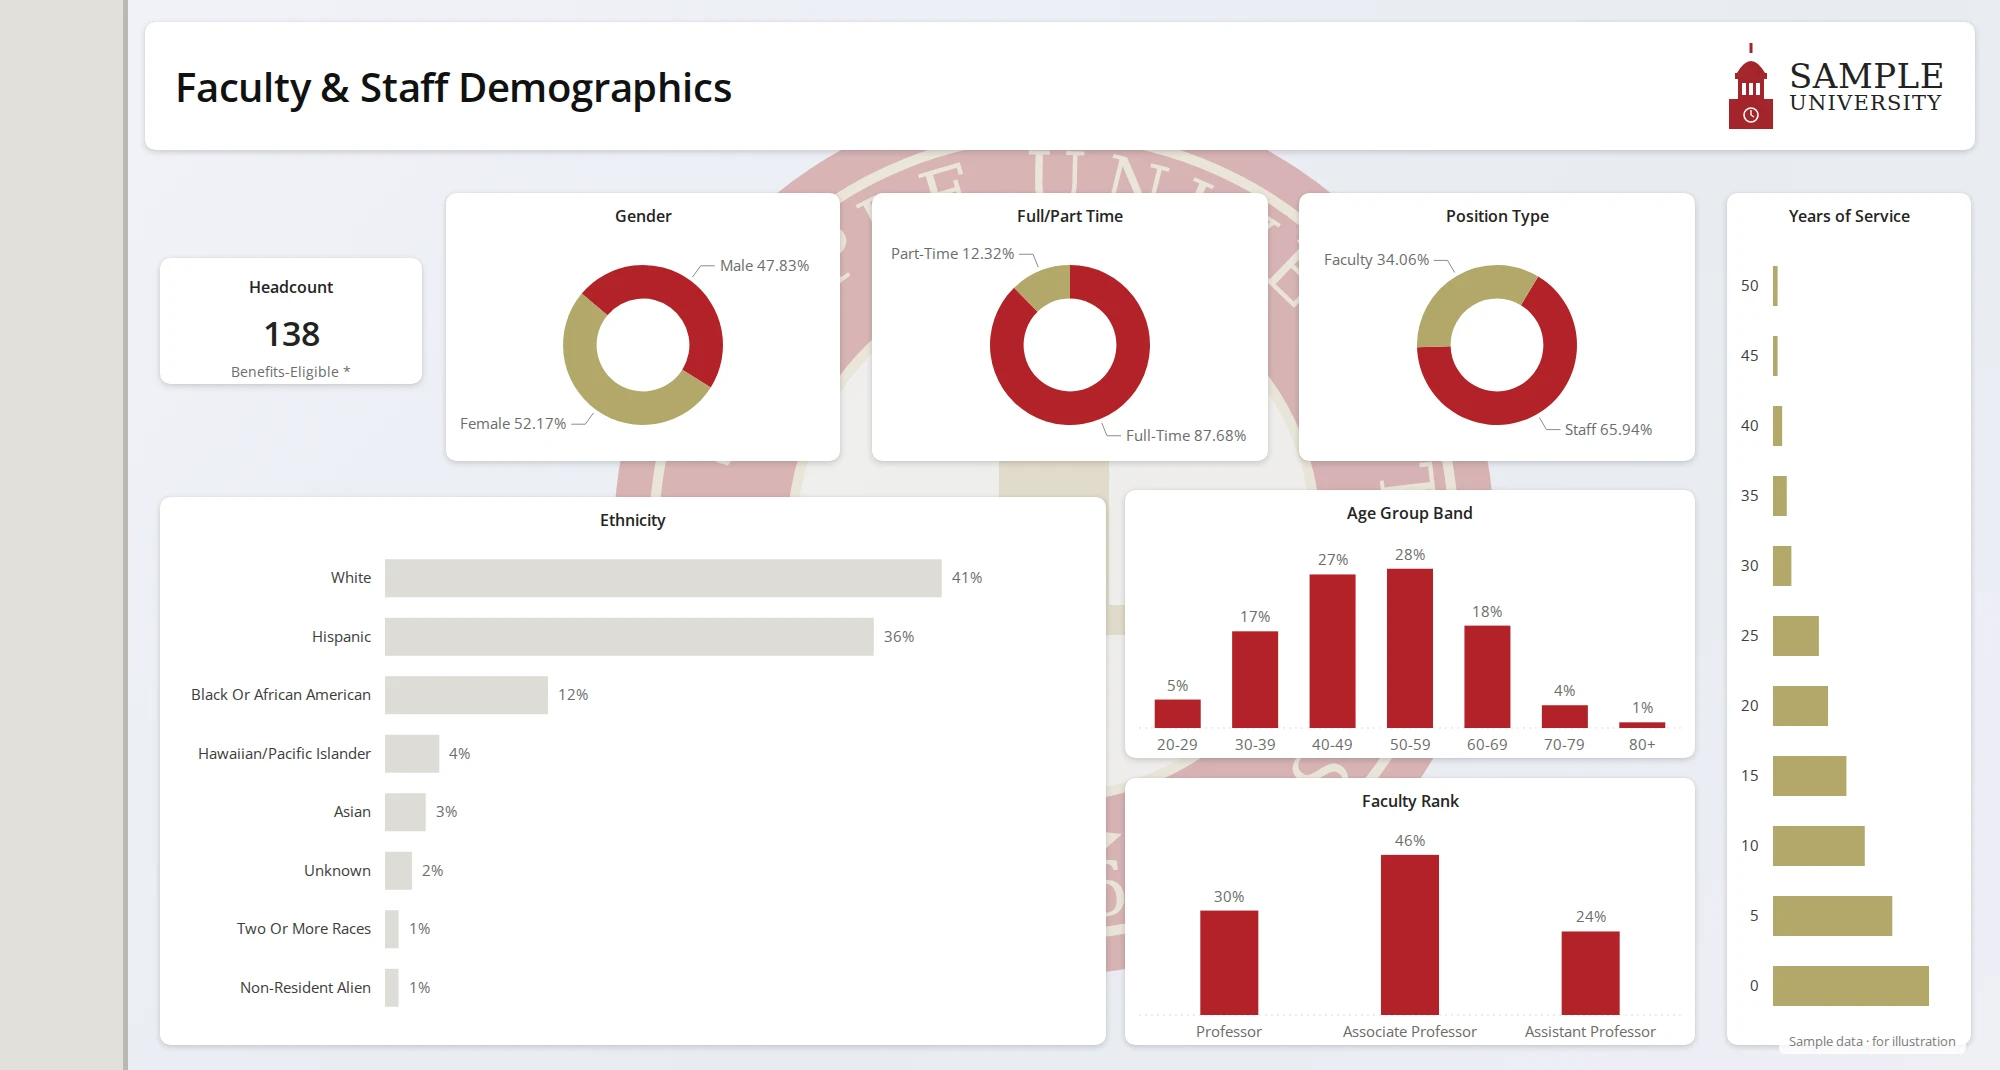
Power BI · People
Workforce composition, representation, and trends across departments, roles, and demographic dimensions.
View full sizeCase studies
What each project had to solve, how it was built, and what it delivered.
Testimonials
Davenee deserves most of the credit. His ability to resolve the data discrepancies with past reports was invaluable.
Colleague
On the ACTS federal submission
Your diligence and attention to detail directly prevented potential fines of $20,000 per report, and that impact cannot be overstated.
Colleague
On the final IPEDS reports
Your hard work, persistence, and attention to detail made a significant difference, and this outcome speaks volumes about your professionalism and dedication.
Colleague
Campus-wide announcement
How I work
Every dashboard starts in a database and ends in an executive meeting. I own the whole path: the SQL, the model, the report, and the version history behind them.
Student, HR, and finance data lives in the ERP: Ellucian Colleague exposed through PostgreSQL views, or Workday and Huron feeding Microsoft Fabric. The first job is knowing where the truth actually lives.
Business rules become governed views: cohort logic, census snapshots, status filters, title standardization, race and ethnicity classification. One CTE, one job, readable by the next analyst.
Power Query connects to the warehouse, applies final shaping, and structures the load so the semantic model stays a clean star schema instead of a pile of flat tables.
DAX measures calculate retention rates, headcount, FFTE, demographic shares, and year-over-year deltas that hold up across every slicer. Definitions live once, in the model, under version control.
Executive-facing reports with drill-through, cross-filtering, and scheduled refresh, so leadership opens a page that is already current and already answers the follow-up question.
Production SQL
Real views behind the production dashboards. One CTE, one job, and comments that explain the why.
Tracking First-Time-in-College retention is critical for accreditation and strategic planning. This view follows federal cohort groups across subsequent fall terms and produces 1-, 3-, and 4-year retention flags that feed the executive dashboard directly.
Cohort definition first, returns second, derived flags last. Active-credit verification and enrollment status checks are applied at each fall checkpoint so the numbers survive an audit.
vw_cohort_retention_analysis.sql
PostgreSQL-- FTIC Cohort Retention Analysis View-- Tracks student retention across 4 years by federal cohortWITH cohort_base AS ( SELECT DISTINCT ost.sttr_student AS studentid, LEFT(sal.sta_fed_cohort_group, 2)::integer AS cohortterm, pnc.gender, xie.ipeds_ethnicity AS raceethnicity, pnc.first_name AS firstname, pnc.last_name AS lastname FROM dbo.ods_student_terms ost JOIN dbo.spt_student_acad_levels sal ON sal.sta_student = ost.sttr_student JOIN dbo.spt_person_non_corp pnc ON pnc.id = ost.sttr_student JOIN dbo.x_ipeds_ethnicity xie ON xie.id = ost.sttr_student WHERE sal.sta_fed_cohort_group IN ( '21FF', '21FP', '22FF', '22FP', '23FF', '23FP', '24FF', '24FP' )),returns_by_term AS ( SELECT sttr_student, sttr_term FROM dbo.ods_student_terms WHERE sttr_term IN ( '2022FA', '2023FA', '2024FA', '2025FA' ) AND sttr_current_status IN ('R', 'T') AND x_sttr_active_cred > 0 GROUP BY sttr_student, sttr_term)SELECT c.studentid, c.cohortterm, CONCAT('20', c.cohortterm, '-', '20', c.cohortterm + 1) AS academicyear, c.gender, c.raceethnicity, CASE c.cohortterm WHEN 21 THEN CASE WHEN r22.sttr_student IS NOT NULL THEN 1 ELSE 0 END WHEN 22 THEN CASE WHEN r23.sttr_student IS NOT NULL THEN 1 ELSE 0 END WHEN 23 THEN CASE WHEN r24.sttr_student IS NOT NULL THEN 1 ELSE 0 END WHEN 24 THEN CASE WHEN r25.sttr_student IS NOT NULL THEN 1 ELSE 0 END END AS oneyearretention, CASE c.cohortterm WHEN 21 THEN CASE WHEN r24.sttr_student IS NOT NULL THEN 1 ELSE 0 END WHEN 22 THEN CASE WHEN r25.sttr_student IS NOT NULL THEN 1 ELSE 0 END END AS threeyearretention, CASE WHEN c.cohortterm = 21 AND r25.sttr_student IS NOT NULL THEN 1 ELSE 0 END AS fouryearretentionFROM cohort_base cLEFT JOIN returns_by_term r22 ON r22.sttr_student = c.studentid AND r22.sttr_term = '2022FA'LEFT JOIN returns_by_term r23 ON r23.sttr_student = c.studentid AND r23.sttr_term = '2023FA'LEFT JOIN returns_by_term r24 ON r24.sttr_student = c.studentid AND r24.sttr_term = '2024FA'LEFT JOIN returns_by_term r25 ON r25.sttr_student = c.studentid AND r25.sttr_term = '2025FA'ORDER BY c.cohortterm, c.lastname, c.firstname;A unified HR view pulling demographics, compensation, and organizational data from multiple source tables. It powers the Staff Demographics dashboard and supports workforce planning.
Multi-level CTEs retrieve salary with fallback logic, CASE statements standardize more than 80 position-title variations, and window functions handle deduplication.
vw_current_employees.sql
PostgreSQL-- Current Employees Roster View-- Comprehensive HR data with salary, demographics, and org structureWITH base AS ( SELECT BTRIM(sp.ppwg_hrp_id::text) AS key_hrp, sp.ppwg_base_et, sp.ppwg_start_date, sp.ppwg_end_date, sp.ppwg_annualized_amt::numeric AS annualized_amt FROM dbo.spt_perposwg sp WHERE sp.ppwg_base_et::text = ANY ( ARRAY['REGU'::text, 'PARS'::text] )),ranked_with_salary AS ( SELECT b.key_hrp, b.annualized_amt, b.ppwg_start_date, b.ppwg_end_date, ROW_NUMBER() OVER ( PARTITION BY b.key_hrp ORDER BY (b.ppwg_end_date IS NULL) DESC, b.ppwg_start_date DESC, b.annualized_amt DESC ) AS rn FROM base b WHERE b.annualized_amt IS NOT NULL AND b.annualized_amt > 0::numeric),ranked_data AS ( SELECT hrper.hrper_id, person.last_name, person.first_name, hrper.hrp_effect_employ_date AS hired_date, CASE WHEN hrper.position_desc::text ~~* '%President%' AND hrper.position_desc::text !~~* '%VP%' THEN 'President'::text WHEN hrper.position_desc::text ~* '^Prof[,.]?\s*(Bus|Business)\s*Admin' THEN 'Professor of Business Administration'::text -- ... 75+ additional CASE conditions ... ELSE INITCAP(hrper.position_desc::text) END AS position_desc_standardized, CASE person.gender WHEN 'M' THEN 'Male' WHEN 'F' THEN 'Female' ELSE 'Not Specified' END AS gender, CASE WHEN person.age >= 79 THEN 'Silent Generation' WHEN person.age >= 60 THEN 'Baby Boomer' WHEN person.age >= 44 THEN 'Generation X' WHEN person.age >= 28 THEN 'Millennial' WHEN person.age >= 12 THEN 'Generation Z' ELSE 'Generation Alpha' END AS generation_label, COALESCE(perstat.perstat_former_service_years, 0::numeric) + COALESCE(hrper.hrp_service_years, 0::numeric) AS total_service_years, pc.salary, ROW_NUMBER() OVER ( PARTITION BY hrper.hrper_id ORDER BY CASE WHEN perstat.perstat_former_service_years IS NOT NULL THEN 0 ELSE 1 END ) AS rn FROM dbo.ods_hrper hrper JOIN dbo.ods_person person ON hrper.hrper_id = person.id LEFT JOIN dbo.ods_depts d ON d.depts_id = hrper.hrp_pri_dept_sort LEFT JOIN dbo.spt_perstat perstat ON hrper.hrper_id = perstat.perstat_hrp_id LEFT JOIN ranked_with_salary pc ON pc.key_hrp = hrper.hrper_id WHERE (hrper.hrp_current_status <> ALL (ARRAY['ST','TE','TM'])) AND (hrper.hrp_effect_term_date > CURRENT_DATE OR hrper.hrp_effect_term_date IS NULL))SELECT * FROM ranked_dataWHERE rn = 1ORDER BY last_name, first_name;Every SQL query, IPEDS submission, and dashboard definition lives in a private GitHub repo, paired with Claude as a FERPA-safe analyst. Claude sees the schema, never the rows.
FERPA-safe AI pairing
Claude reviews table and column names, never student rows. Only the schema leaves the warehouse.
Version-controlled SQL
Branches for experiments, pull requests for review, history for audits. Nothing is a one-off in a notebook.
Decisions written down
Metric definitions and edge cases captured in markdown next to the code, so the next analyst onboards in days.
Reproducible reporting
IPEDS submissions and dashboards trace back to a commit. Re-run last year's numbers exactly and defend every figure.
ir-warehouse · git log
maina3f1c20 (main) Add FTIC fall-to-fall retention CTE8b2e4d9 Refactor IPEDS race/ethnicity rollup view1c9a07f Document headcount vs. FTE definitions───────────────────────────────────────────+ schema/students.sql (columns only)+ queries/retention.sql claude-paired+ docs/decisions.md why, not what
Experience
Enterprise analytics at UCF by day. Consulting for the university that trained me.
Jul 2026 – presentOrlando, FL
University of Central Florida
Analytics & Integrated Planning, Office of the Provost
2024 – presentKeene, TX
Southwestern Adventist University
Office of Institutional Research & Effectiveness
2024
Southwestern Adventist University
Microsoft Certified: Power BI Data Analyst Associate (PL-300), in progress.
Skills
Grouped by how I use them, not by a percentage. Everything in the first two columns has shipped to production.
Tools I open every day.
Shipped and maintained in production.
Used on real projects, still growing.
Consulting
Currently partnering with Southwestern Adventist University on institutional research analytics, and taking on new engagements across Power BI, PostgreSQL, Microsoft Fabric, Argos-to-Power BI migration, and IPEDS.
Services & engagement modelsGoverned semantic models and executive-ready reports.
Documented views your IR team can maintain.
22+ production reports migrated so far.
Five annual surveys authored end to end.
Contact
Project inquiries, dashboard requests, collaboration, or a role. I reply within one business day.
daveneejames@gmail.com · Orlando, FL · Open for consulting